Part 1: Your First Pipeline
In this part, you will go from a fresh RAT installation to a running pipeline with queryable data. You will learn the core workflow: write SQL → preview → publish → run → query.
Time required: ~15 minutes
Prerequisites: RAT is running (Installation)
What You Will Build
A Bronze pipeline called raw_launches that generates a small sample of space launch
data using a SQL VALUES clause. This is intentionally simple — we are focusing on the
workflow, not the data. In Part 2, you will switch to real CSV data.
Start the Platform
If RAT is not already running, start it now:
make upWait until all 7 services report healthy:
docker compose -f infra/docker-compose.yml psThe first start takes 2-5 minutes to build images. Subsequent starts are much faster. If you need help, see the Installation guide.
Tour the Portal
Open http://localhost:3000 in your browser. You will see the RAT Portal — your only interface for managing pipelines, running queries, and exploring data.
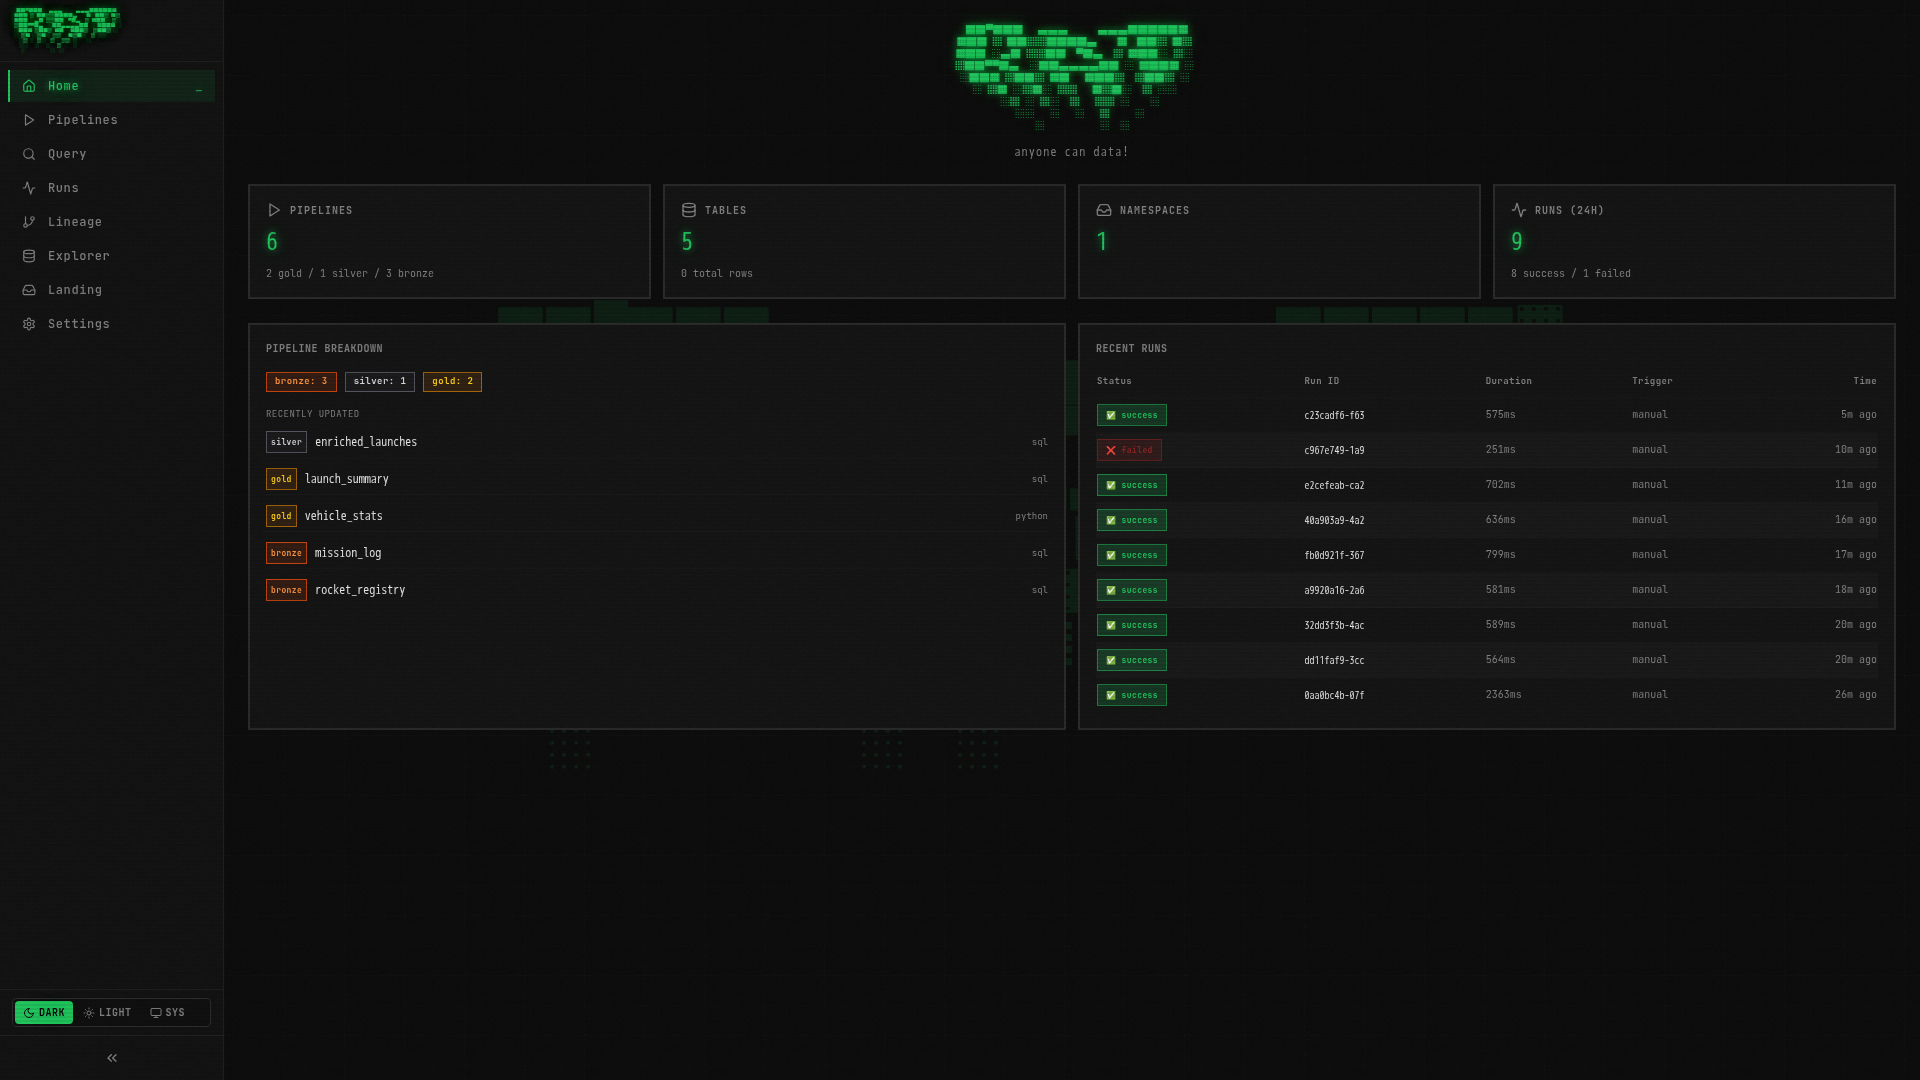
The left sidebar has 8 navigation items:
| Page | What it does |
|---|---|
| Home | Dashboard with stats and recent activity |
| Pipelines | List, create, and manage all pipelines |
| Query | Interactive SQL editor (powered by DuckDB) |
| Runs | History of all pipeline executions |
| Lineage | Visual DAG showing data flow between pipelines |
| Explorer | Browse tables, schemas, and documentation |
| Landing | Manage file drop zones for data ingestion |
| Settings | Platform configuration and retention policies |
Take a moment to click through each page. They are all empty right now — that is about to change.
Create Your First Pipeline
Open the Pipelines page
Click Pipelines in the left sidebar. The page is empty since you have not created any pipelines yet.
Create a new pipeline
Click the + New Pipeline button in the top-right corner. A dialog will appear:
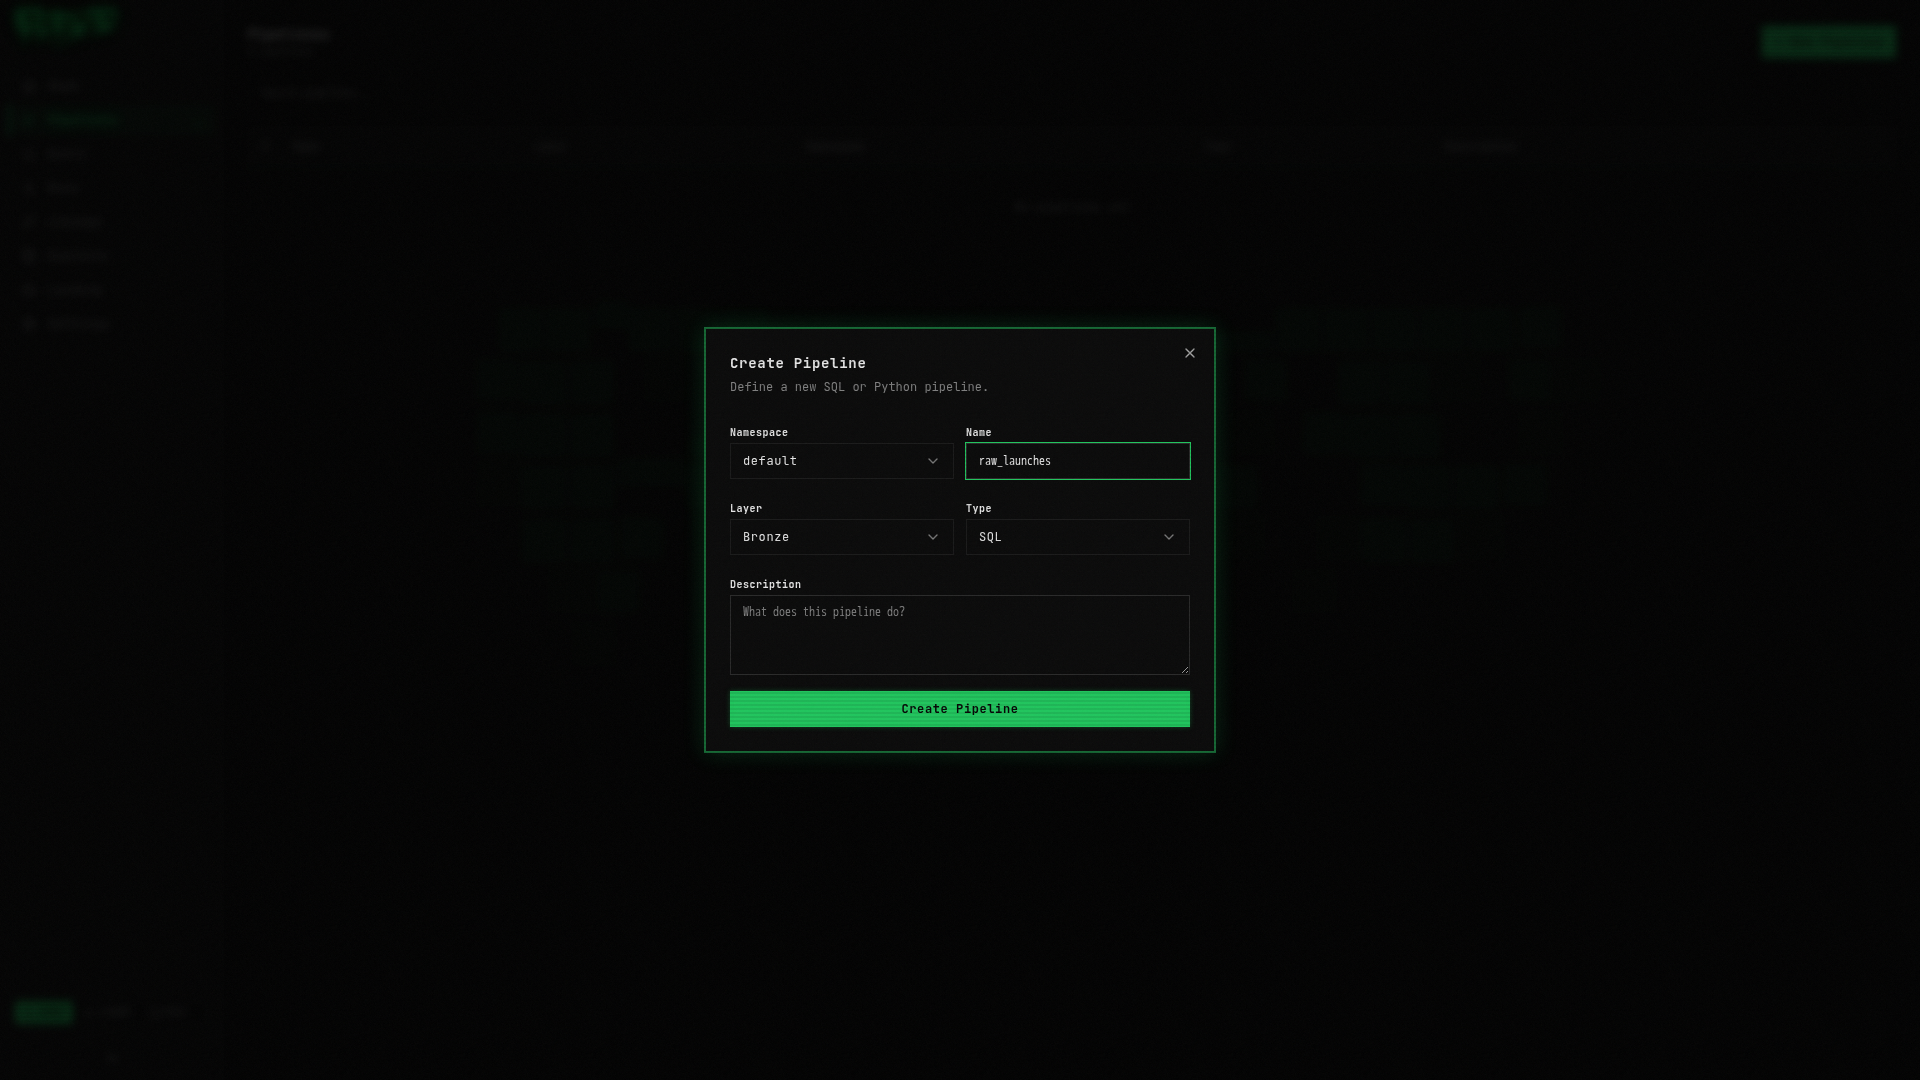
Fill in the following:
| Field | Value | Description |
|---|---|---|
| Namespace | default | Logical grouping for your pipelines |
| Layer | bronze | The medallion layer (bronze = raw data) |
| Name | raw_launches | A descriptive name |
| Type | sql | Pipeline language (SQL or Python) |
Click Create.
Every pipeline in RAT has a unique address: namespace.layer.name. Your pipeline is
default.bronze.raw_launches. This triple is used everywhere — in ref() calls,
table names, API endpoints, and the file system.
Write the SQL
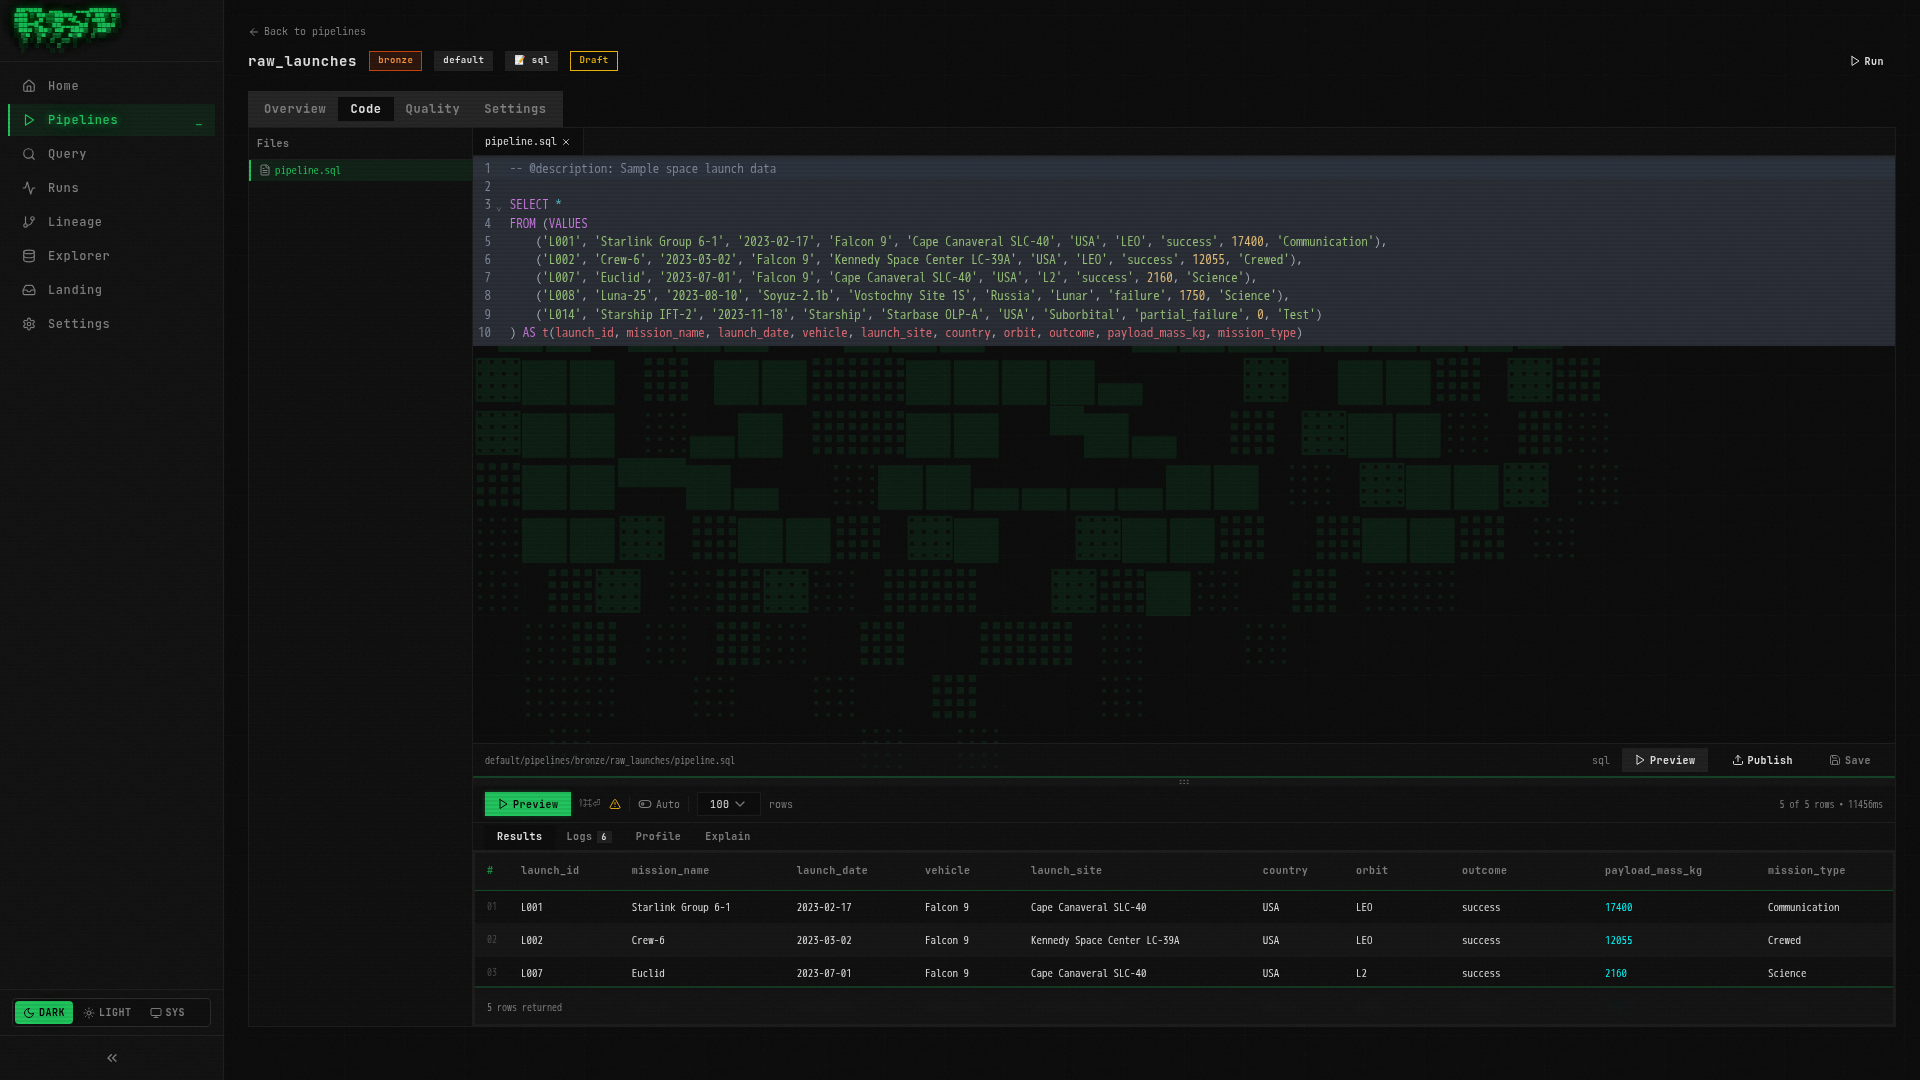
You are now on the pipeline detail page with the Code tab open. You will see a CodeMirror SQL editor. Replace any placeholder content with:
-- @description: Sample space launch data

SELECT *
FROM (VALUES
    ('L001', 'Starlink Group 6-1', '2023-02-17', 'Falcon 9', 'Cape Canaveral SLC-40', 'USA', 'LEO', 'success', 17400, 'Communication'),
    ('L002', 'Crew-6', '2023-03-02', 'Falcon 9', 'Kennedy Space Center LC-39A', 'USA', 'LEO', 'success', 12055, 'Crewed'),
    ('L007', 'Euclid', '2023-07-01', 'Falcon 9', 'Cape Canaveral SLC-40', 'USA', 'L2', 'success', 2160, 'Science'),
    ('L008', 'Luna-25', '2023-08-10', 'Soyuz-2.1b', 'Vostochny Site 1S', 'Russia', 'Lunar', 'failure', 1750, 'Science'),
    ('L014', 'Starship IFT-2', '2023-11-18', 'Starship', 'Starbase OLP-A', 'USA', 'Suborbital', 'partial_failure', 0, 'Test')
) AS t(launch_id, mission_name, launch_date, vehicle, launch_site, country, orbit, outcome, payload_mass_kg, mission_type)
This generates 5 sample launches — a mix of successes, a failure, and a partial failure. We are keeping it small for now. Part 2 will bring in the full 25-row dataset.
Save the pipeline
Press Ctrl+S (or Cmd+S on macOS). A confirmation toast will appear.
Always save before running. RAT autosaves drafts, but the executor picks up the last explicitly saved version.
Preview the output
Before committing to a real run, preview what your SQL produces. Press Ctrl+Shift+Enter (or Cmd+Shift+Enter).
The preview panel opens below the editor, showing a results table:
| launch_id | mission_name | launch_date | vehicle | country | outcome | payload_mass_kg |
|---|---|---|---|---|---|---|
| L001 | Starlink Group 6-1 | 2023-02-17 | Falcon 9 | USA | success | 17400 |
| L002 | Crew-6 | 2023-03-02 | Falcon 9 | USA | success | 12055 |
| L007 | Euclid | 2023-07-01 | Falcon 9 | USA | success | 2160 |
| L008 | Luna-25 | 2023-08-10 | Soyuz-2.1b | Russia | failure | 1750 |
| L014 | Starship IFT-2 | 2023-11-18 | Starship | USA | partial_failure | 0 |
Preview runs your SQL in a read-only DuckDB session (via ratq). Nothing is written to the catalog — it just shows you the output shape. Use it to iterate quickly.
Publish the pipeline
Click the Publish button in the toolbar. Publishing creates a versioned snapshot of your code. This is the version that will execute when you trigger a run.
Think of publishing like a git commit — it captures a point-in-time snapshot. You can always roll back to a previous version from the Overview tab. We will cover versioning in detail in Part 8.
Run the pipeline
Click the Run button (play icon) in the toolbar. A confirmation dialog may appear — click Confirm.
Here is what happens behind the scenes:
- ratd (API server) creates a run record in Postgres
- ratd dispatches the run to the runner via gRPC
- The runner asks Nessie to create an isolated branch
- DuckDB executes your SQL and produces an Arrow table (5 rows)
- PyIceberg writes the Arrow table as Parquet files to MinIO (S3)
- Quality tests run (none configured yet — skip)
- Nessie merges the branch back to
main - The run is marked success
Watch the run
You will be taken to the Run Detail page. Here you can see:
- Status badge — transitions from
pending→running→success - Live logs — streamed in real-time via SSE
- Duration — how long the run took
- Trigger — shows
manual
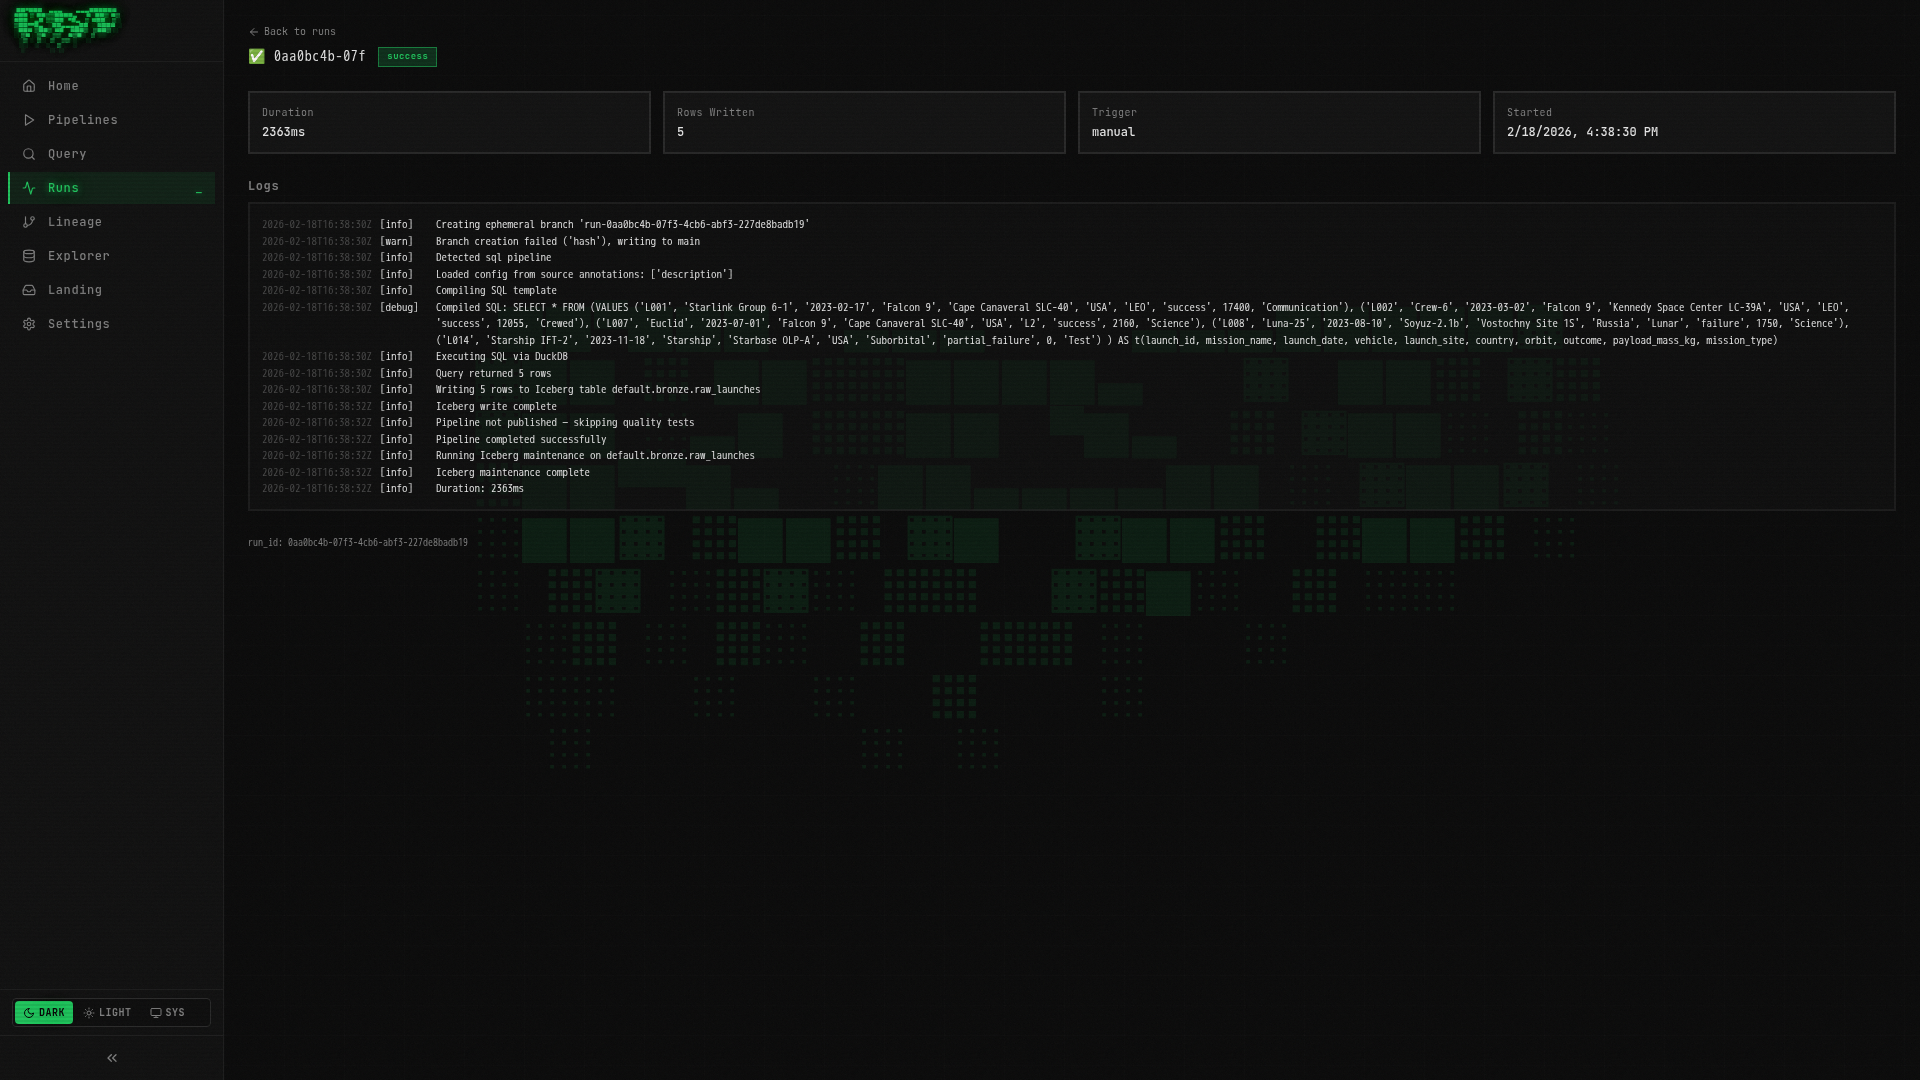
The logs will look something like:
[INFO]  Starting pipeline: default.bronze.raw_launches
[INFO]  Creating branch: run-abc123
[INFO]  Executing SQL pipeline...
[INFO]  Query produced 5 rows
[INFO]  Writing to Iceberg table: default.bronze.raw_launches
[INFO]  No quality tests configured — skipping
[INFO]  Merging branch: run-abc123 → main
[INFO]  Pipeline completed successfully in 2.1s
If the run fails, check the logs for error details. Common issues: SQL syntax errors, or services still initializing after a fresh start. You can re-run after fixing issues.
Query the results
Navigate to Query in the left sidebar. This opens the interactive SQL editor powered by DuckDB (via ratq).
Type the following and press Ctrl+Enter:
SELECT * FROM "default"."bronze"."raw_launches"You should see your 5 rows:
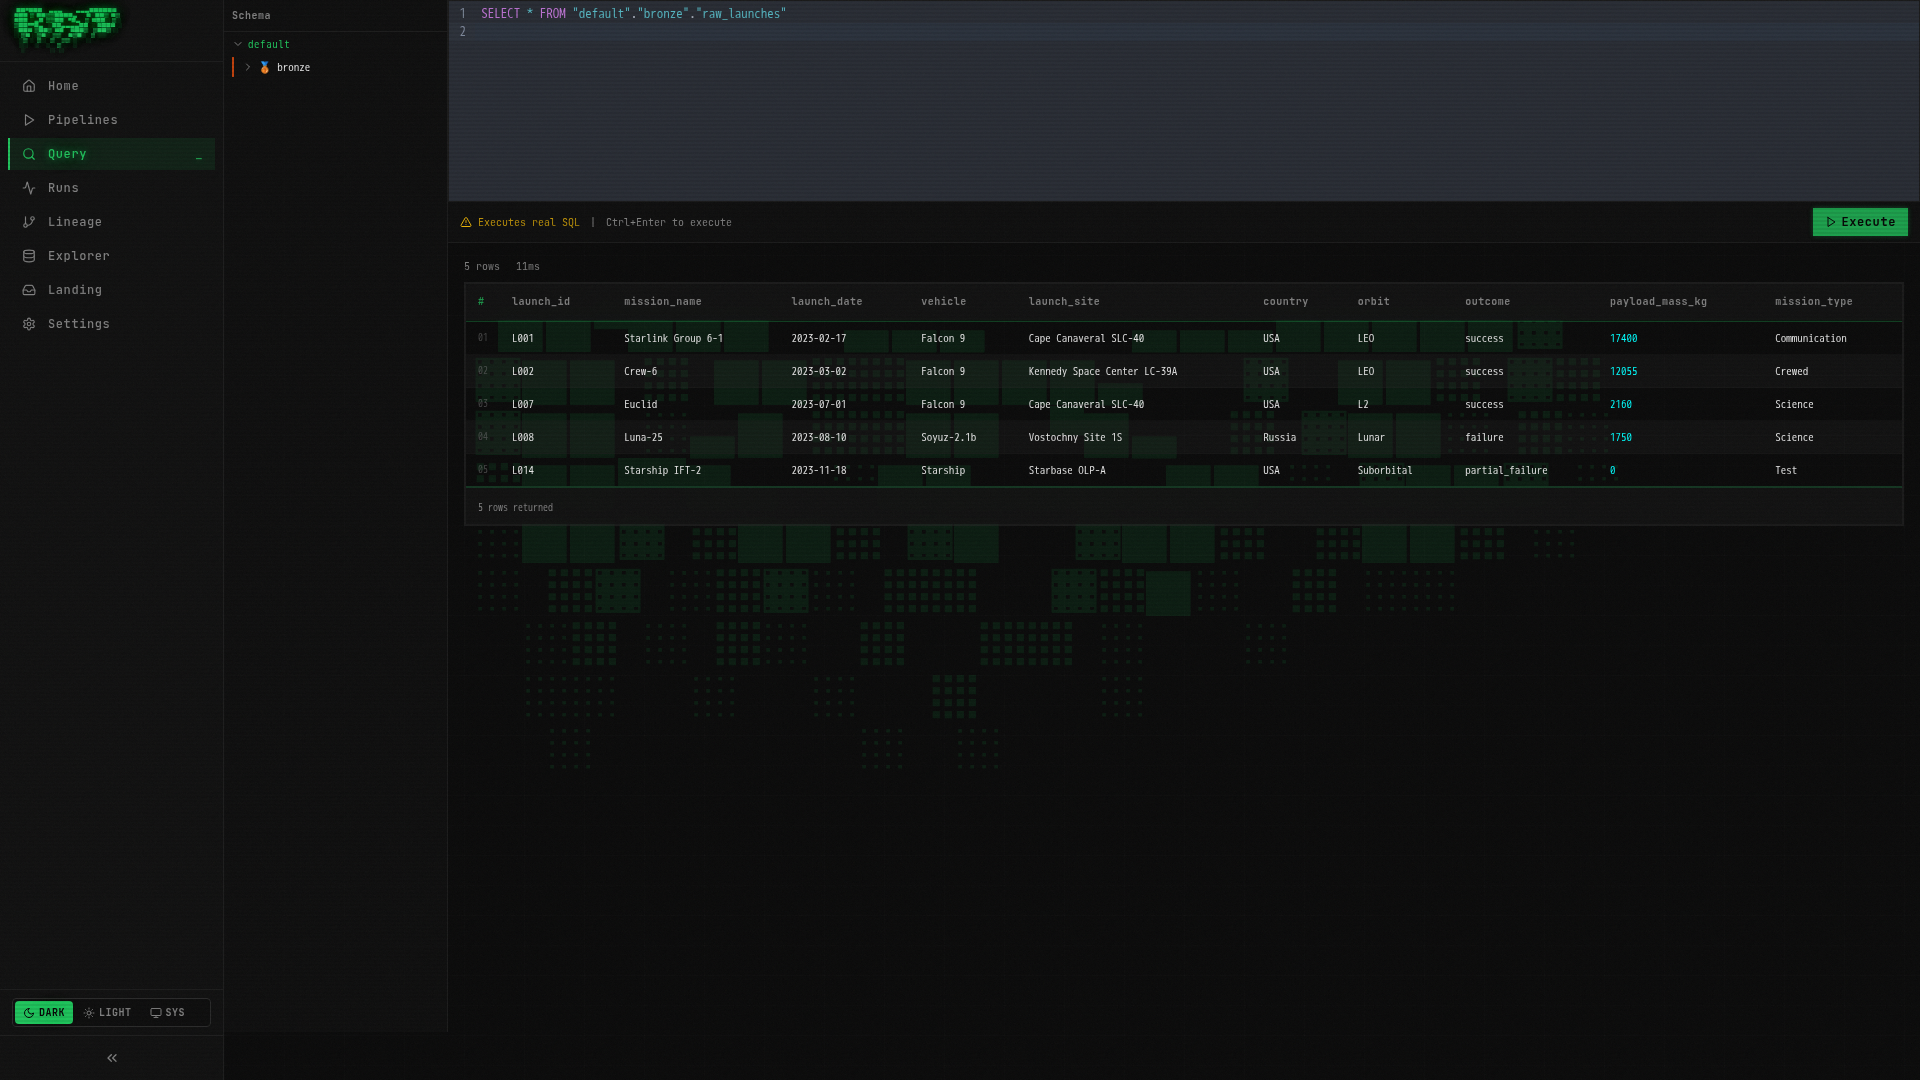
Table names follow the pattern "namespace"."layer"."pipeline_name". The double quotes
are required — DuckDB uses them for identifier quoting.
Try a more interesting query:
SELECT
    outcome,
    COUNT(*) AS launches,
    SUM(payload_mass_kg) AS total_payload_kg
FROM "default"."bronze"."raw_launches"
GROUP BY outcome
ORDER BY launches DESC
Explore the table
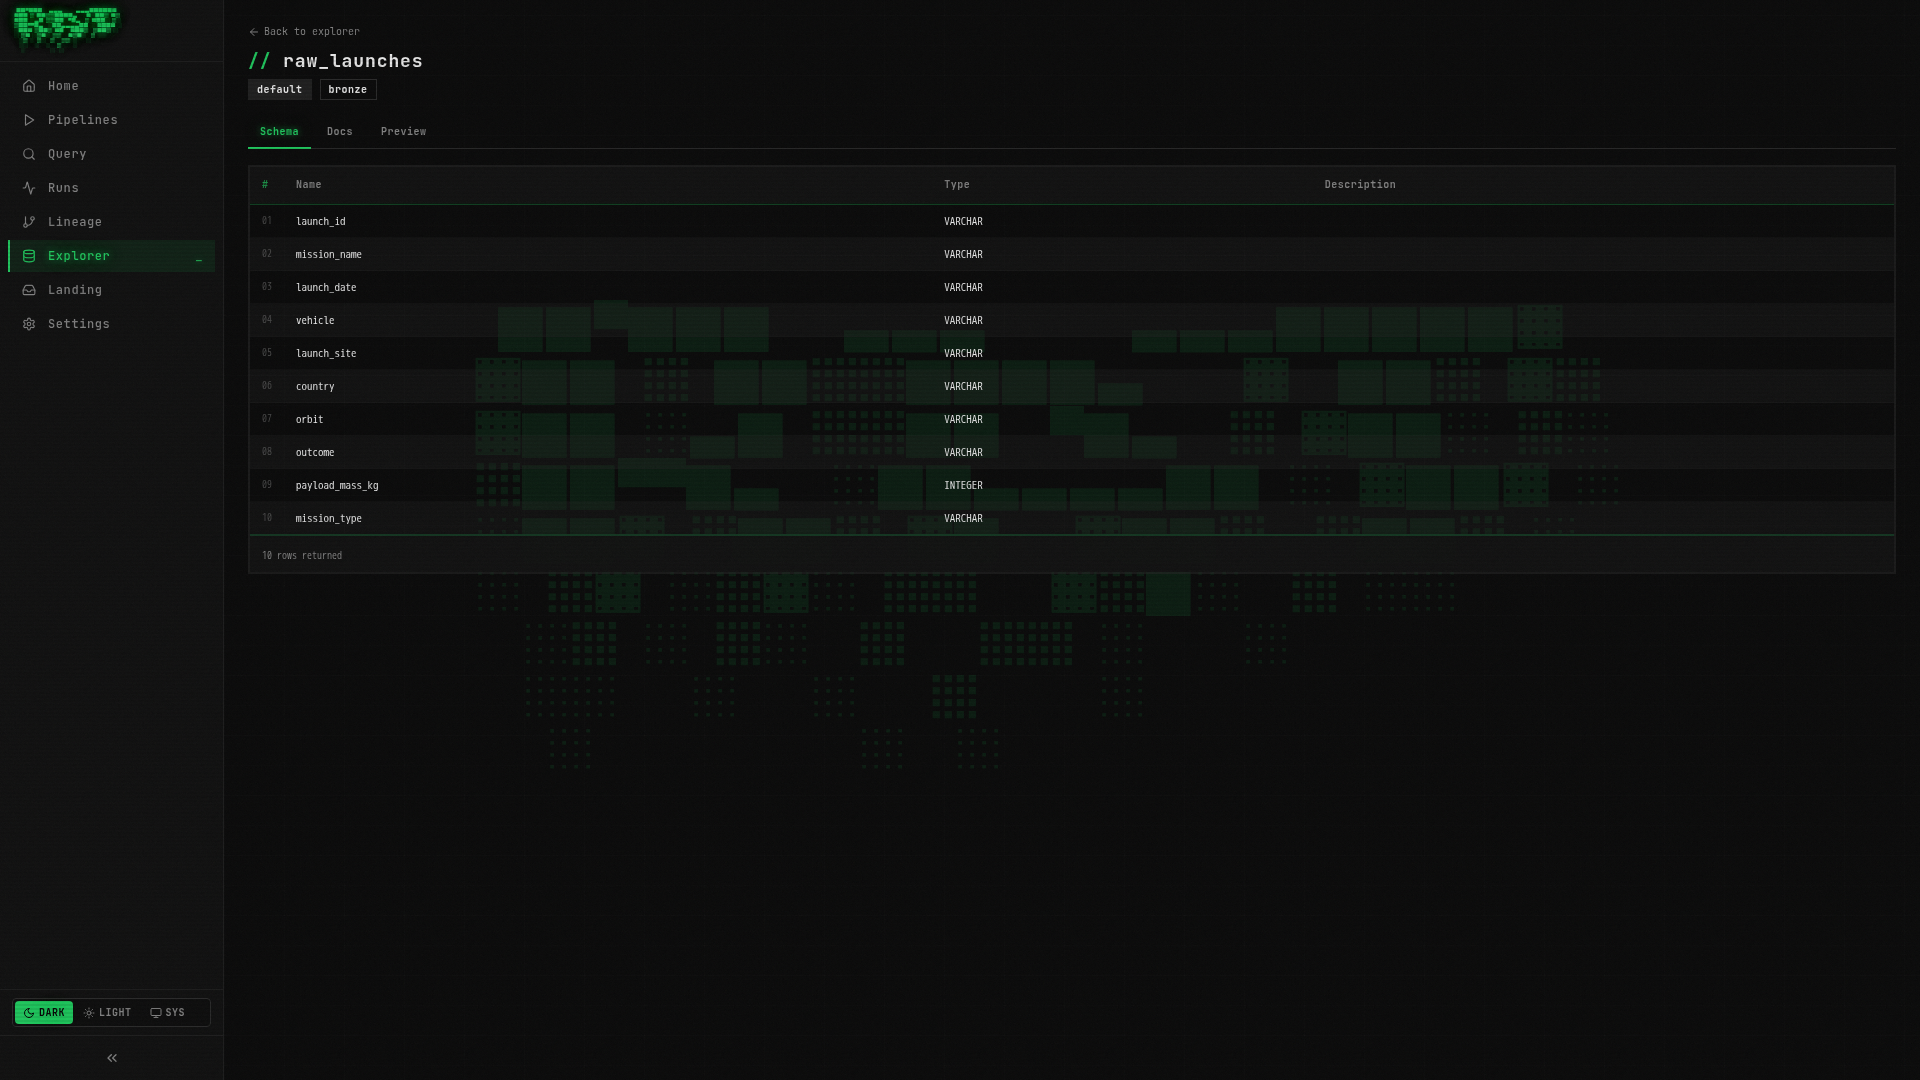
Navigate to Explorer in the left sidebar. Your table appears in the tree:
default/
  bronze/
    raw_launches (5 rows)
Click raw_launches to see the table detail with three tabs:
- Schema — column names, types, and nullability
- Docs — editable documentation (add descriptions for each column)
- Preview — quick look at sample data
What Just Happened?
You just completed the full RAT pipeline lifecycle:
Every pipeline in RAT follows this same flow, whether it is a simple Bronze ingestion or a complex Gold aggregation. The tools change (SQL vs Python, VALUES vs landing zones, full refresh vs incremental), but the workflow stays the same.
Quick Reference
| Action | Shortcut |
|---|---|
| Save pipeline | Ctrl+S / Cmd+S |
| Preview output | Ctrl+Shift+Enter / Cmd+Shift+Enter |
| Run query | Ctrl+Enter / Cmd+Enter |
| Concept | Example |
|---|---|
| Pipeline address | default.bronze.raw_launches |
| Table name in queries | "default"."bronze"."raw_launches" |
| Reference in pipeline SQL | {{ ref('bronze.raw_launches') }} |
Next Steps
In Part 1, you used static VALUES data. That is fine for learning, but real platforms
need real data. In Part 2, you will upload CSV files through landing zones and build
pipelines that ingest them automatically.