Part 8: Gold Layer & Complete Platform 🏆
Time: ~15 minutes | Prerequisites: Part 7 completed (triggers configured)
This is the final part of the tutorial. You will create a Gold pipeline, wire the complete trigger chain from landing zone to analytics, and explore the platform features that take RAT from a development tool to a production system: versioning, data retention, table documentation, and the query editor.
By the end, you will have a fully automated data platform.
Create the Gold Pipeline
Gold pipelines produce analytics-ready aggregations — the data your dashboards, reports,
and stakeholders consume. Let’s create launch_summary: country-level launch statistics
by year.
Create a new pipeline
Navigate to Pipelines → click New Pipeline.
| Field | Value |
|---|---|
| Name | launch_summary |
| Namespace | default |
| Layer | gold |
| Language | SQL |
Write the SQL
-- @description: Country-level launch statistics by year
-- @merge_strategy: full_refresh

SELECT
    country,
    EXTRACT(YEAR FROM launch_date::DATE) AS launch_year,
    COUNT(*) AS total_launches,
    SUM(CASE WHEN outcome = 'success' THEN 1 ELSE 0 END) AS successes,
    ROUND(100.0 * SUM(CASE WHEN outcome = 'success' THEN 1 ELSE 0 END) / COUNT(*), 1) AS success_rate_pct,
    SUM(payload_mass_kg) AS total_payload_kg,
    COUNT(DISTINCT vehicle) AS unique_vehicles,
    STRING_AGG(DISTINCT mission_type, ', ' ORDER BY mission_type) AS mission_types
FROM {{ ref('silver.enriched_launches') }}
GROUP BY country, launch_year
ORDER BY launch_year DESC, total_launches DESC
This query:
- Groups by country and year — giving you a row per country per year
- Counts launches and successes — with a computed success rate percentage
- Sums payload mass — total kg launched per country per year
- Counts unique vehicles — how many different rockets each country used
- Aggregates mission types — comma-separated list of mission types per group
Preview
Click Preview to verify the results. You should see rows like USA, 2024, 8 launches, 87.5% success rate — one row per country-year combination.
Publish
Click Publish. Enter version message: "Initial gold aggregation".
Run
Click Run to execute the pipeline and write the results to Iceberg.
Chain the Gold Trigger
Now let’s complete the automation chain: Gold runs automatically after Silver.
Open Gold pipeline settings
Navigate to Pipelines → launch_summary → Settings tab.
Add a pipeline_success trigger
Click Add Trigger → select pipeline_success.
| Field | Value |
|---|---|
| Pipeline Namespace | default |
| Pipeline Layer | silver |
| Pipeline Name | enriched_launches |
| Enabled | true |
| Cooldown (seconds) | 0 |
Save
Click Save. The complete chain is now wired.
Run the Full Chain
Let’s test the entire automation pipeline end-to-end.
Trigger the chain
You have two options:
Navigate to Landing Zones → launch-data → upload space_launches.csv.
The landing zone upload trigger fires mission_log.
Watch the domino effect
Go to the Runs page and watch the cascade:
| Order | Pipeline | Layer | Trigger |
|---|---|---|---|
| 1 | mission_log | 🥉 Bronze | landing_zone_upload (or manual) |
| 2 | enriched_launches | 🥈 Silver | pipeline_success → mission_log |
| 3 | launch_summary | 🥇 Gold | pipeline_success → enriched_launches |
Three pipelines, zero manual clicks after the initial trigger.
Verify the Gold data
Navigate to Query and run:
SELECT *
FROM default.gold.launch_summary
ORDER BY launch_year DESC, total_launches DESC
You should see country-level statistics — the final analytics-ready output.
The launch_vehicle_stats Python pipeline you created in Part 6 is not part of this
chain — it runs independently. In a real platform, you might add its own triggers or
include it in a separate chain. Not every pipeline needs to be in the same DAG.
View the Complete Lineage
Navigate to the Lineage page (sidebar → Lineage, or go to /lineage directly).
You should now see the full DAG with all nodes:
The lineage DAG shows every pipeline, every ref() dependency, and the landing zones
that feed into Bronze. Click any node to jump to that pipeline’s detail page.
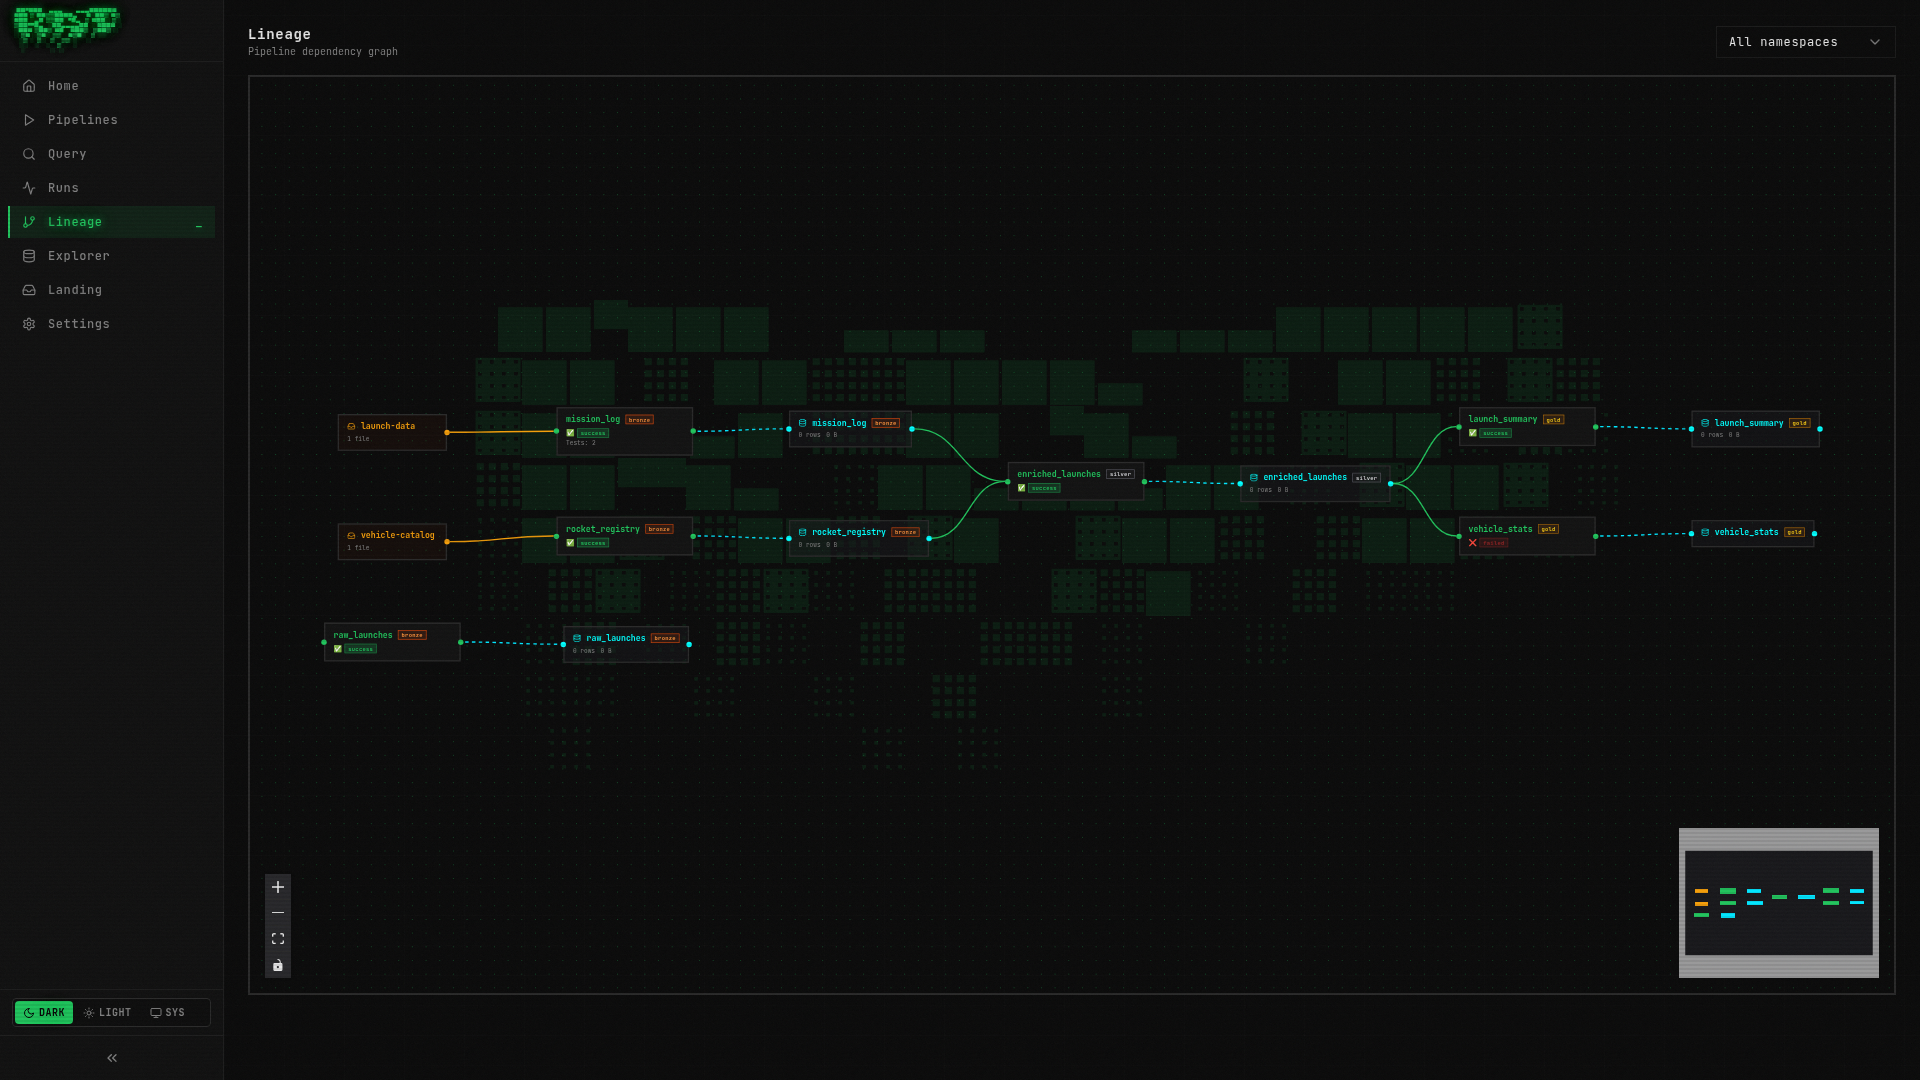
The Lineage page is invaluable for impact analysis. If a Bronze source breaks, you can immediately see which Silver and Gold pipelines are affected — and who needs to be notified.
Pipeline Versioning
You have already been publishing pipelines throughout this tutorial. Let’s take a deeper look at how versioning works and how to use rollbacks.
How It Works
When you click Publish, RAT takes a snapshot of all files in the pipeline directory —
the SQL/Python source, config.yaml, and quality tests. This snapshot is stored as a
version with an auto-incrementing number. Runs always execute against the published
version, so you can freely edit code without affecting scheduled or triggered runs.
Explore Version History
Open a pipeline overview
Navigate to Pipelines → enriched_launches → Overview tab.
View the version history
Scroll down to the Version History section. You should see at least one version:
Version 1 — "Initial pipeline"
            Published during Part 3
Edit the code
Go to the Code tab. Add a comment at the top:
-- @description: Launches enriched with vehicle specifications (improved)Save the file. Notice the Unpublished Changes badge appears on the Overview tab.
Publish a new version
Go back to Overview → click Publish. Enter: "Update description annotation".
Now you have two versions:
Version 2 — "Update description annotation"
            Published just now

Version 1 — "Initial pipeline"
            Published earlier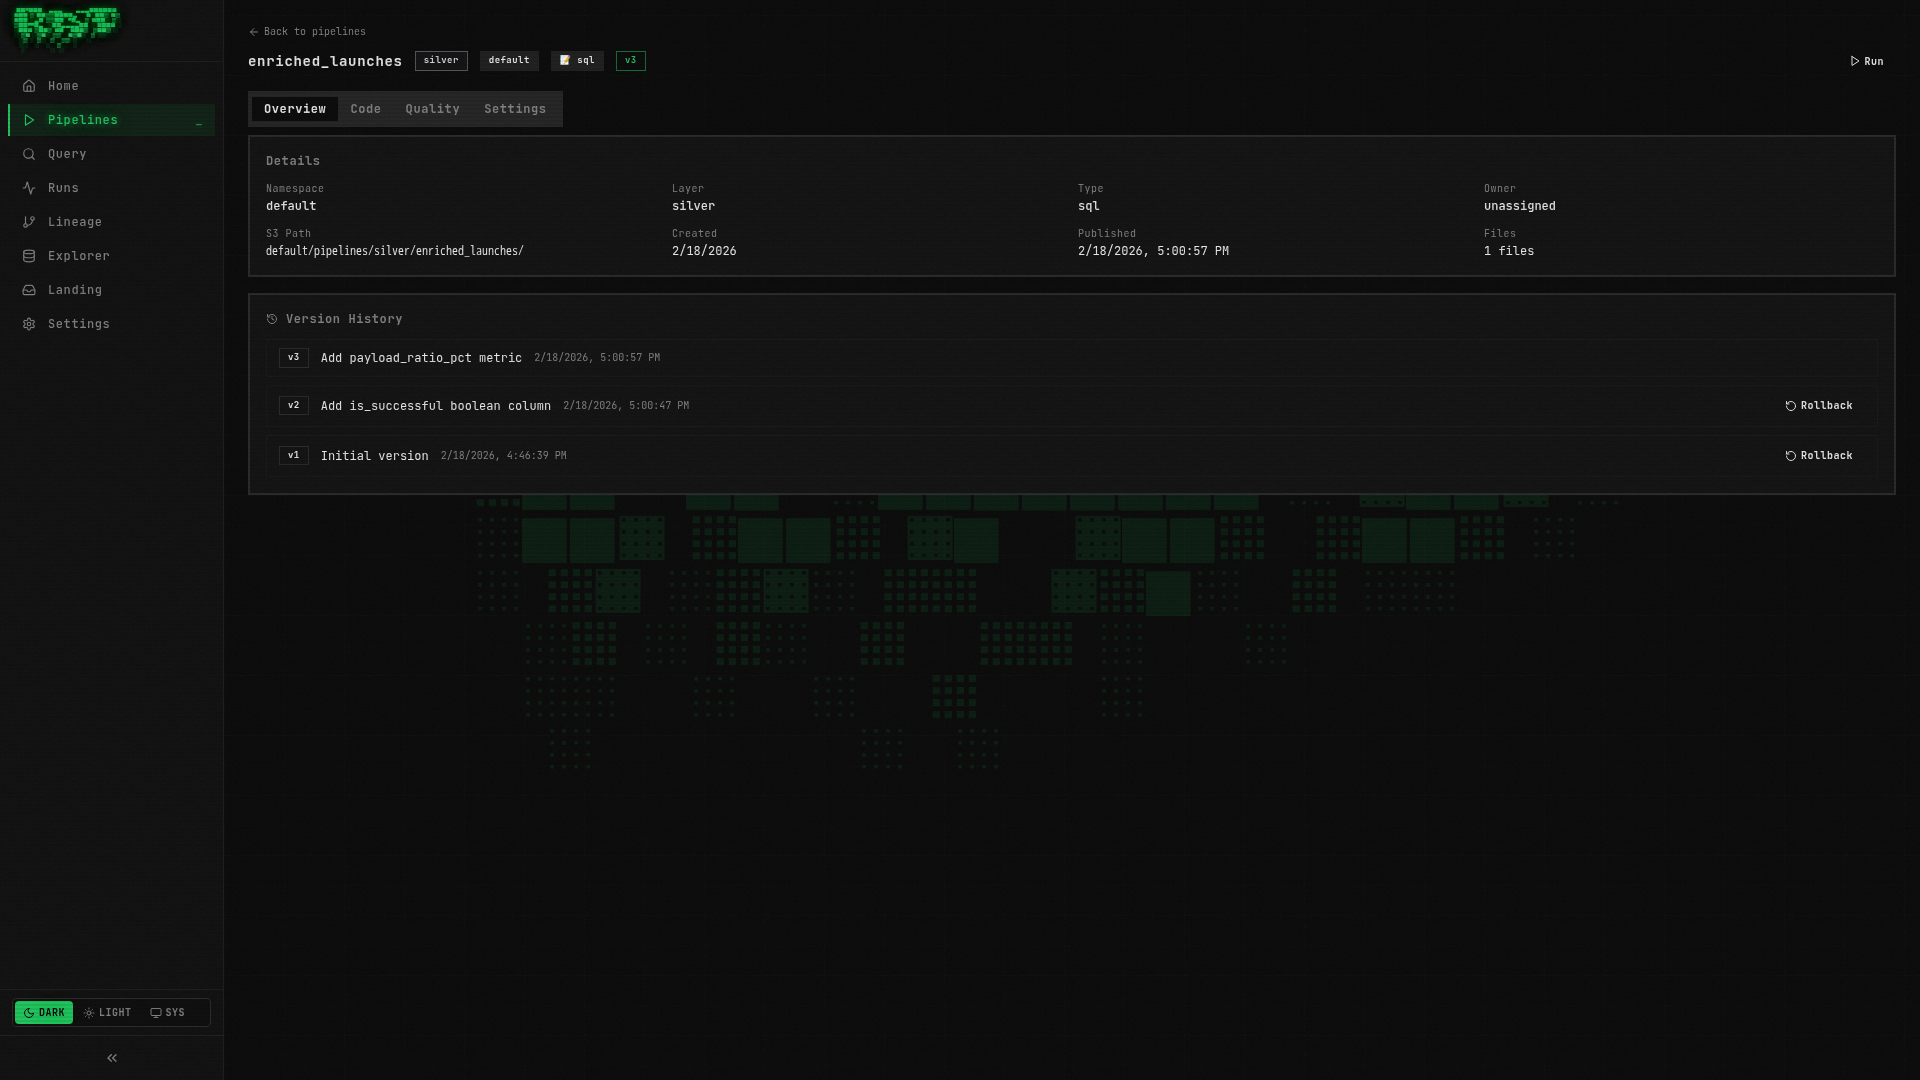
Rolling Back
If a published version introduces a bug, you can roll back to a previous version. RAT’s rollback is forward-only — it creates a new version with the old code, rather than deleting history.
Find the target version
In the version history, locate Version 1.
Click Rollback
Click the Rollback button next to Version 1. RAT creates:
Version 3 — "Rollback to version 1"
            Published just now

Version 2 — "Update description annotation"
            Still in history

Version 1 — "Initial pipeline"
            The rollback target
Rollback never deletes history. Every change creates a new version, maintaining a
complete audit trail. This is analogous to git revert (new commit with old content)
rather than git reset (erasing history).
Data Retention
A production platform accumulates data over time: run records, logs, quality test results, orphan Nessie branches, expired Iceberg snapshots. RAT’s retention system keeps this in check automatically.
Two Cleanup Systems
| System | Language | Handles |
|---|---|---|
| System Reaper | Go (runs inside ratd) | Prune old runs, fail stuck runs, clean orphan Nessie branches, purge soft-deleted pipelines, clean processed landing zone files, prune audit logs |
| Iceberg Maintenance | Python (runs inside runner) | Expire old Iceberg snapshots, clean orphan data files, compact manifests |
Configure Retention
Navigate to Settings
Click Settings in the sidebar navigation.
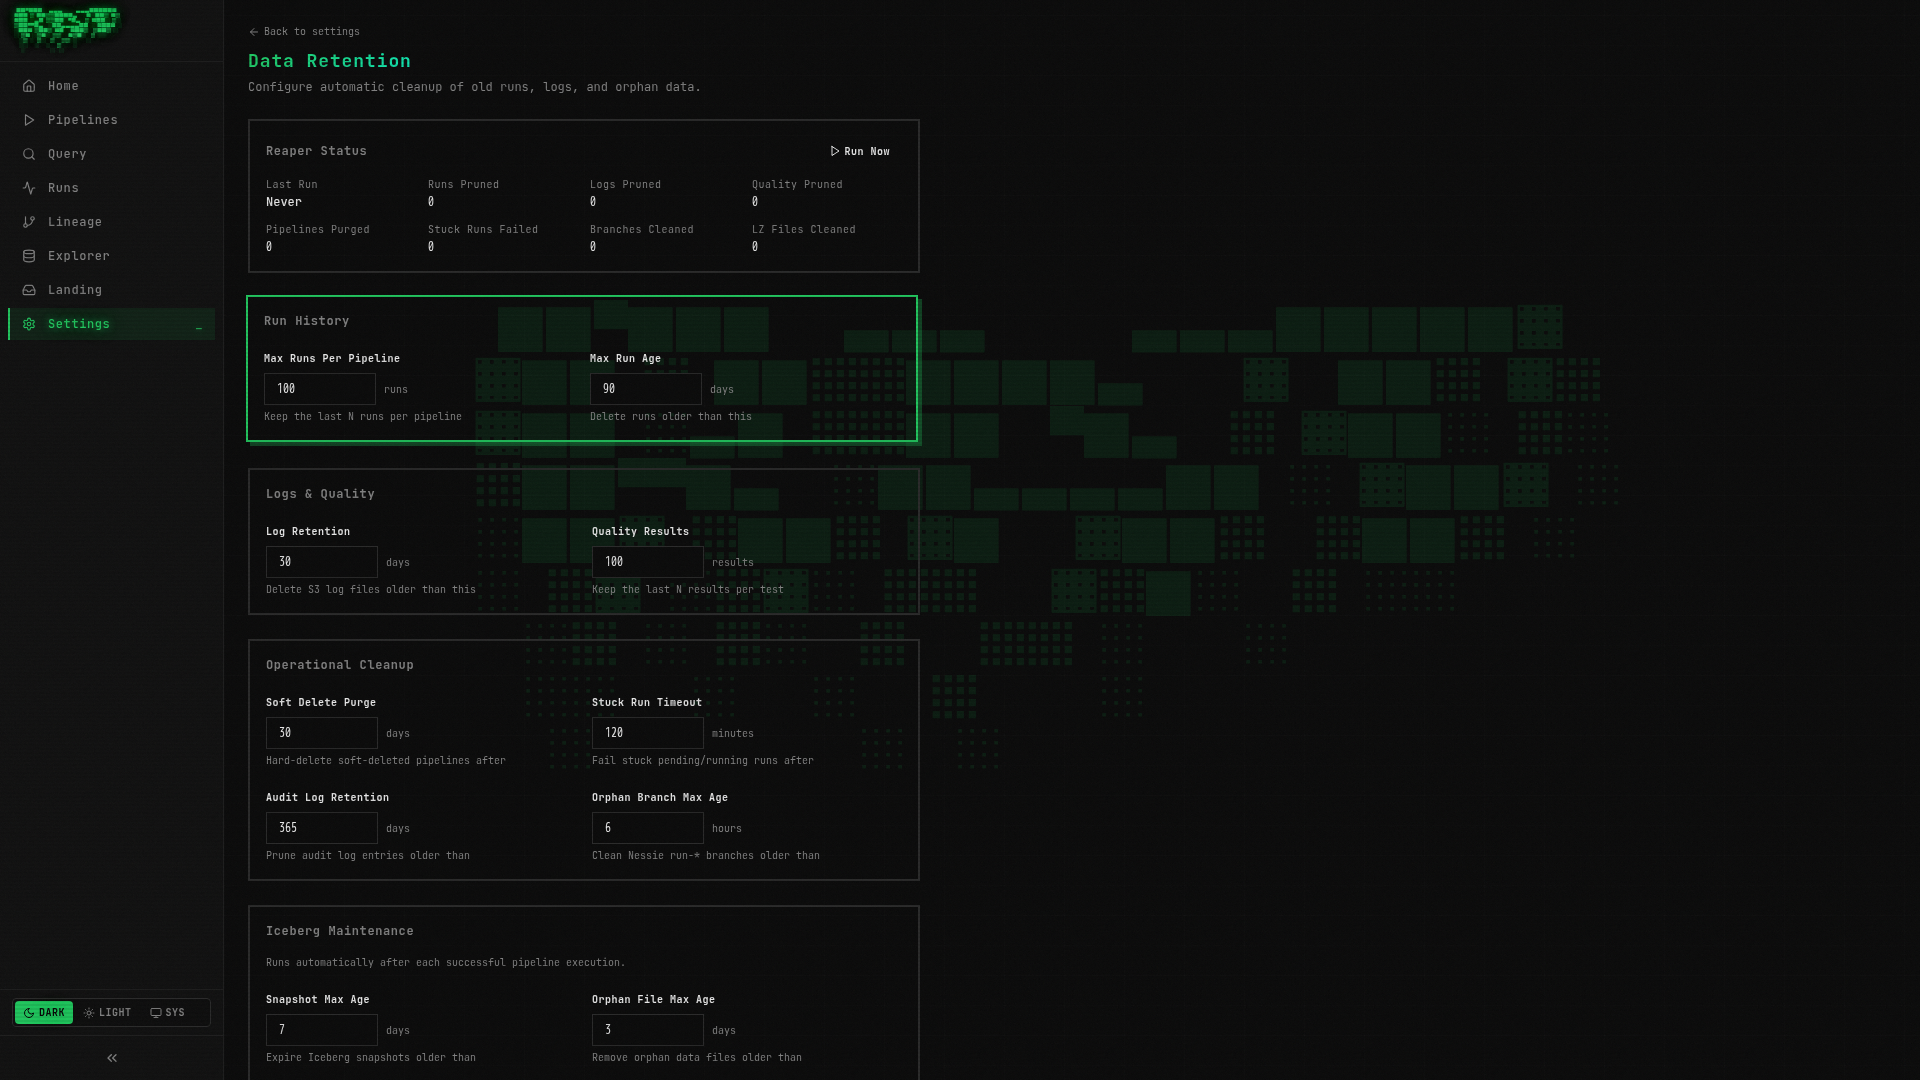
Open the Retention tab
You will see all retention configuration fields with their current values:
| Field | Default | What It Does |
|---|---|---|
runs_max_per_pipeline | 100 | Maximum run records kept per pipeline |
runs_max_age_days | 90 | Runs older than this are pruned |
logs_max_age_days | 30 | Run logs in S3 older than this are deleted |
stuck_run_timeout_minutes | 30 | Runs stuck in running status are auto-failed |
nessie_orphan_branch_max_age_hours | 6 | Orphan run-* branches are cleaned up |
iceberg_snapshot_max_age_days | 7 | Old Iceberg snapshots are expired |
reaper_interval_minutes | 15 | How often the reaper daemon runs |
Review the defaults
For this tutorial, the defaults are fine. In a production deployment, you might lower
runs_max_per_pipeline for high-frequency pipelines or increase runs_max_age_days
for regulated data.
Individual pipelines can override the system-wide retention settings. In the pipeline Settings tab, expand Retention Override to set per-pipeline values for runs and logs retention.
Table Documentation
Good metadata makes a data platform usable by others (or by future you). RAT lets you document tables and their columns directly in the Portal.
Navigate to Explorer
Click Explorer in the sidebar. You will see a tree of all namespaces, layers, and tables.
Click a table
Click default → gold → launch_summary to open the table detail view.
Open the Docs tab
Click the Docs tab. You will see all columns listed with empty description fields.
Add column descriptions
Fill in descriptions for key columns:
| Column | Description |
|---|---|
country | Country that performed the launch |
launch_year | Calendar year of the launch |
total_launches | Total number of launches by this country in this year |
success_rate_pct | Percentage of launches with outcome = success |
total_payload_kg | Sum of payload mass in kilograms |
unique_vehicles | Number of distinct launch vehicles used |
mission_types | Comma-separated list of mission types |
Save
Click Save. These descriptions are now visible to anyone browsing the Explorer — and they appear in the schema sidebar of the Query page.
Table documentation is stored as metadata in the platform, not in the pipeline code. This means analysts who don’t write pipelines can still contribute documentation.
Query Editor Deep Dive
You have used the Query page throughout this tutorial, but let’s explore its full capabilities.
Open the Query page
Navigate to Query in the sidebar.
Browse the schema sidebar
On the left, you will see a schema browser listing all tables organized by namespace → layer → table. Each table shows its columns and types. Click a table name to insert it into the editor at the cursor position.
Write a rich query
Let’s write a comprehensive query against the Gold table:
SELECT
    ls.country,
    ls.launch_year,
    ls.total_launches,
    ls.successes,
    ls.success_rate_pct,
    ls.total_payload_kg,
    ls.unique_vehicles,
    ls.mission_types,
    -- Compare to previous year
    LAG(ls.total_launches) OVER (
        PARTITION BY ls.country ORDER BY ls.launch_year
    ) AS prev_year_launches,
    ls.total_launches - COALESCE(LAG(ls.total_launches) OVER (
        PARTITION BY ls.country ORDER BY ls.launch_year
    ), 0) AS yoy_change
FROM default.gold.launch_summary ls
ORDER BY ls.country, ls.launch_year DESC
This query adds year-over-year comparisons using window functions — the kind of analysis that Gold tables are built for.
Run with Ctrl+Enter
Press Ctrl+Enter (or Cmd+Enter on Mac) to execute the query. Results appear in the table below the editor with sortable columns and type-colored values.
Explore the results
The data table supports:
- Column sorting — click any column header
- Row numbers — displayed in the leftmost column
- Type-colored values — numbers, strings, dates, and nulls are visually distinct
- Copy to clipboard — select rows or the entire result set
What You Built — The Complete Picture
Congratulations! Over 8 parts, you have built a fully automated space launch analytics platform. Here is everything in your pipeline graph:
Pipelines
| Pipeline | Layer | Language | Merge Strategy | Trigger |
|---|---|---|---|---|
mission_log | 🥉 Bronze | SQL | Incremental (watermark) | Cron + Landing zone upload |
rocket_registry | 🥉 Bronze | SQL | Full refresh | — |
enriched_launches | 🥈 Silver | SQL | Full refresh | Pipeline success → mission_log |
launch_vehicle_stats | 🥈 Silver | Python | Full refresh | Webhook |
launch_summary | 🥇 Gold | SQL | Full refresh | Pipeline success → enriched_launches |
Landing Zones
| Zone | Feeds Into |
|---|---|
launch-data | mission_log |
vehicle-catalog | rocket_registry |
Quality Tests
| Test | Pipeline | Severity | Rule |
|---|---|---|---|
no-null-ids | mission_log | Error | No NULL launch_id values |
valid-outcomes | mission_log | Warn | All outcomes must be known values |
Architecture
What You Learned
- Part 1 — Created your first SQL pipeline, previewed it, published it, ran it
- Part 2 — Set up landing zones, uploaded CSV data, ingested it into Bronze
- Part 3 — Built Silver pipelines with
ref()joins, explored the lineage DAG - Part 4 — Made pipelines incremental with watermark-based merge strategies
- Part 5 — Added quality tests to gate bad data before it reaches production
- Part 6 — Wrote Python pipelines with DuckDB + PyArrow and the security sandbox
- Part 7 — Automated everything with triggers: cron, landing zone, pipeline_success, webhook
- Part 8 — Completed the Gold layer, explored versioning, retention, docs, and the query editor
Where to Go Next
The tutorial covered the core workflow, but RAT has more to offer. Here are the best next steps depending on what you want to do.
Deep dives into SQL pipelines, Python pipelines, merge strategies, landing zones, incremental loading, quality tests, triggers, scheduling, versioning, and data retention.
Complete reference for annotations, SQL templating, configuration options, the TypeScript SDK, and the full REST API (75+ endpoints).
Understand how RAT works under the hood: services, pipeline execution, Nessie branching, storage layout, the plugin system, and the database schema.
Tip: The Guides section covers advanced patterns not in this
tutorial — SCD Type 2 (slowly changing dimensions), snapshot strategies, partitioning,
cross-namespace references, and complex trigger chains with cron_dependency.
Thanks for completing the tutorial! You now have a working data platform. Go build something great. 🐀